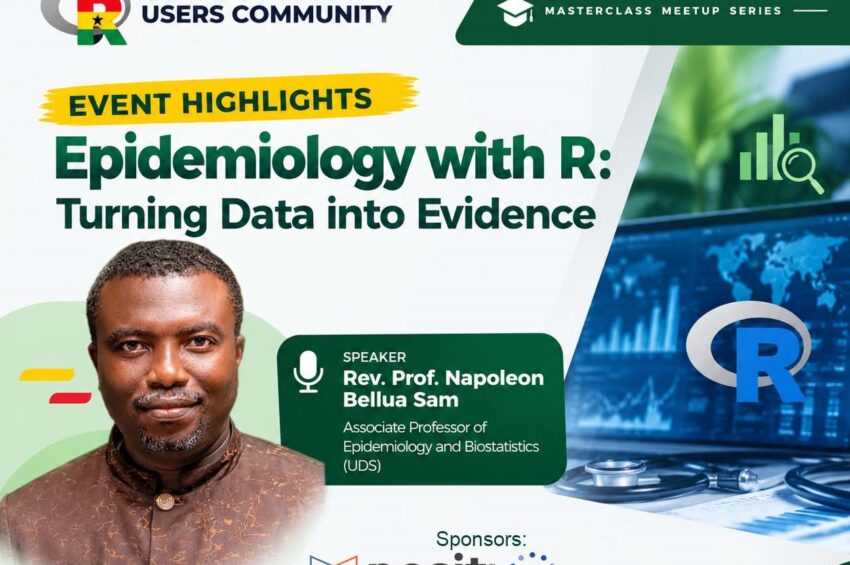
The Ghana R Users Community successfully hosted its Masterclass Meetup Series, “Epidemiology with R: Turning Data into Evidence,” on 23rd–24th September 2026, bringing together researchers, public health professionals, students, data enthusiasts, and R users for a session focused on the practical role of R in epidemiological work.
The meetup was led by Rev. Prof. Napoleon Bellua Sam, Associate Professor of Epidemiology and Biostatistics at the University for Development Studies (UDS). The session focused on how epidemiologists can use R to make the journey from health data to analysis, reporting, and evidence more efficient and reproducible.
From Traditional Epidemiology to R-Powered Practice
A central theme of the session was the changing nature of epidemiological practice.
Rev. Prof. Sam described the distinction between what he referred to as the traditional manual epidemiologist and the modern R-powered epidemiologist. His argument was not that R replaces epidemiological knowledge, but that it provides tools that can make epidemiological work faster, more systematic, and more productive.
One of the examples used during the presentation was data cleaning. Manual cleaning of a large outbreak or COVID-19 dataset can take considerable time, whereas an R-based workflow can automate many of the repetitive tasks. The same principle applies to epidemiological calculations and reporting: once the appropriate code has been developed, analyses can be repeated as new data become available rather than recreated manually each time.
This emphasis on efficiency was one of the practical messages running through the masterclass.
Building the Right Skills for Epidemiology with R
The session then moved into the competencies needed to work effectively with R in epidemiology.
Participants were introduced to the use of R across several stages of the epidemiological workflow, including data management and cleaning, descriptive analysis, analytical modelling, visualisation, interpretation, and publication-ready reporting. Rev. Prof. Sam noted that while R may not be the tool used for every stage of a research project, it becomes particularly useful once researchers begin working with the data and analysing the resulting information.
The presentation also stressed that understanding the structure of a dataset before running an analysis is important. Participants were shown how R can be used to inspect imported data, examine variables and their types, identify missing observations and duplicates, create new variables, and group continuous variables such as age into meaningful categories.
These steps may appear basic, but they form an important part of ensuring that subsequent analyses are based on properly understood and prepared data.
Working with Epidemiological Data
The practical examples covered a range of common epidemiological tasks.
R can be used to work with data from different sources and formats, including CSV and statistical software datasets. Once the data are imported, researchers can inspect the first records, review summaries, check the structure of variables, and identify potential problems before proceeding with analysis.
The session also introduced approaches to handling missing data and duplicate observations, creating calculated variables and indicators, grouping observations, and producing descriptive summaries.
The underlying message was straightforward: good analysis starts with properly managed data.
Descriptive and Analytical Epidemiology
The masterclass went beyond data preparation to demonstrate how R can support both descriptive and analytical epidemiology.
For descriptive epidemiology, the discussion considered the traditional epidemiological dimensions of person, place, and time. Participants were shown how R can be used to summarise characteristics such as age and sex, examine geographical patterns, and explore disease occurrence over time.
The analytical component included examples of multivariable logistic regression, where R can be used to examine relationships between exposures and outcomes while accounting for other variables. One example considered whether smoking is associated with the odds of developing hypertension after adjusting for age and BMI.
The presentation further demonstrated how model results can be transformed into epidemiologically useful measures such as odds ratios and confidence intervals, as well as formatted into tables suitable for reporting and publication.
Survival Analysis, Mapping and Disease Surveillance
Another part of the session explored survival analysis, including the use of proportional hazards models and Kaplan–Meier curves for analysing time-to-event data. These methods have applications in areas such as clinical trials and longitudinal studies.
The discussion also extended to spatial epidemiology. R can support the analysis and visualisation of geographical patterns, including disease hotspots and spatial clusters. The presentation highlighted the potential to overlay disease incidence data onto district boundaries to identify areas with higher disease burdens and support more targeted public health interventions.
Time-series analysis and forecasting were also discussed in the context of disease surveillance. Such approaches can help researchers examine seasonal patterns, identify outbreak peaks, and support longer-term public health planning.
From Analysis to Publication-Ready Output
An important part of the masterclass was the discussion around what happens after the analysis.
Rather than treating statistical output as the end of the process, Rev. Prof. Sam highlighted the importance of producing clear, reproducible and publication-ready results. The session demonstrated how R can be used to generate summary tables, epidemiological charts, maps and other outputs without repeatedly copying results between different applications.
The presentation also introduced R Markdown and Quarto as tools for reproducible reporting. The idea is to keep the analysis and reporting process connected so that results can be regenerated when the underlying data or analysis changes, reducing the need for manual copying and formatting.
This is particularly useful in epidemiological work, where datasets may be updated regularly and reports may need to be produced repeatedly.
Looking Beyond the Immediate Analysis
Towards the end of the session, the discussion turned to the future of epidemiology and the growing role of machine learning and artificial intelligence.
The presentation touched on applications including outbreak forecasting, real-time surveillance, electronic health records, genomic epidemiology, pathogen mapping, and precision public health.
The broader point was that the epidemiologist of today increasingly needs to be comfortable working with data as well as with the traditional foundations of epidemiology. R provides one of the tools through which this expanded role can be supported.
R as a Partner in Public Health
The masterclass closed with a broader reflection on the role of R.
R was presented not simply as a programming language, but as a tool that can complement epidemiological expertise and help make research and public health work more efficient, transparent, reproducible and evidence-driven.
The session reinforced a simple but important idea: the value of R lies not in replacing epidemiological thinking, but in helping researchers and practitioners work more effectively with the data on which that thinking depends.
As Rev. Prof. Sam emphasised, the goal is ultimately to move from data to actionable knowledge and better public health decisions. The second second session of this meetup will feature the practical aspect of the session later.
Watch the replay of the session below
<iframe width=”560″ height=”315″ src=”https://www.youtube.com/embed/tXkRLnCg9Os?si=CoYwy5pMa3Zx48vH” title=”YouTube video player” frameborder=”0″ allow=”accelerometer; autoplay; clipboard-write; encrypted-media; gyroscope; picture-in-picture; web-share” referrerpolicy=”strict-origin-when-cross-origin” allowfullscreen></iframe>
Special Appreciation
We extend our sincere appreciation to Posit PBC and the R Consortium for their generous sponsorship and continued support for the growth of the R community. Your support makes it possible to create accessible learning opportunities and strengthen data science, research, and statistical computing capacity across Ghana.
We also thank Rev. Prof. Napoleon Bellua Sam for sharing his knowledge and experience with the community, as well as all participants, members, and everyone who contributed to the success of the masterclass.
At the Ghana R Users Community, we remain committed to creating spaces where people can learn, share, collaborate, and grow through the use of R and related technologies.